Guide
How to Build a Revenue Forecast and Scenario Model in Excel with AI
Build a driver-based revenue forecast in Excel with base, best-case, and worst-case scenarios using AI instead of manual scenario tables and linked formulas.
Introduction
Revenue forecasting is a common Excel task used to estimate future income and support planning. A single forecast, however, is often not enough. Revenue changes with customer growth, churn, pricing, upgrades, downgrades, and one-off revenue items.
That is why scenario modeling matters. Instead of only projecting historical revenue forward, a stronger model forecasts the underlying business drivers and shows how different assumptions change the outcome.
Scenario
A subscription software startup tracks monthly operating metrics such as:
- starting customers
- new customers acquired
- customers lost to churn
- average revenue per customer
- expansion revenue
- contraction revenue
- one-time fees
The team already has a spreadsheet showing historical performance, but it does not forecast the next few months.
Leadership wants to:
- forecast revenue for the next 6 months
- understand how customer growth and churn affect revenue
- compare possible business outcomes under uncertainty
They specifically want three scenarios:
- Base Case: expected growth and churn
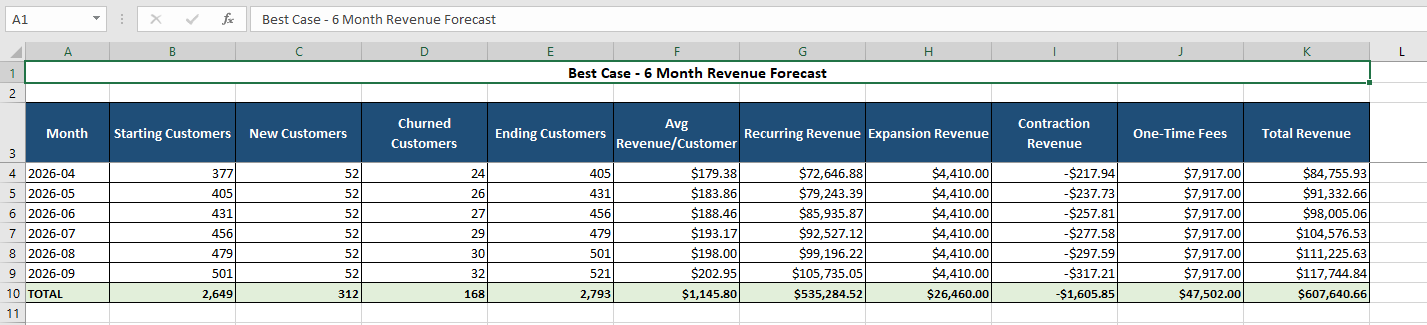
- Best Case: stronger growth, lower churn, better pricing
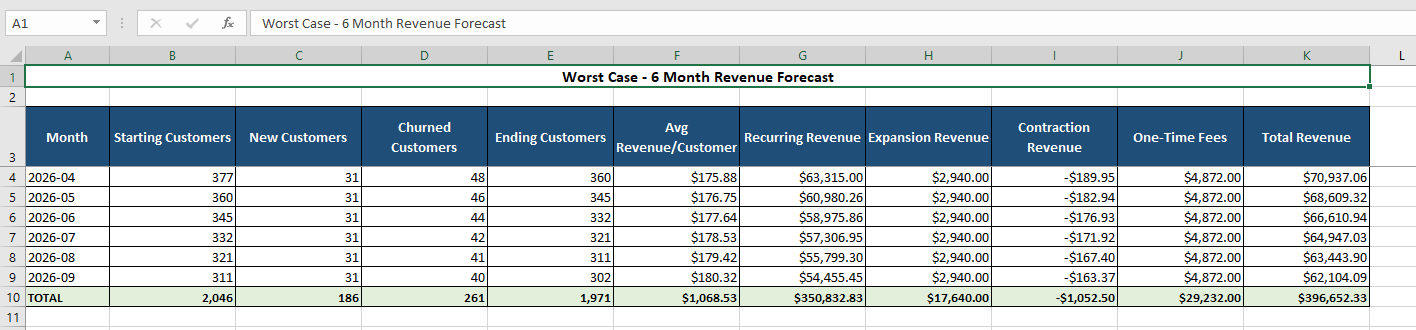
- Worst Case: slower growth, higher churn, weaker expansion
Building this manually in Excel would require multiple linked formulas, assumptions tables, and scenario logic. They want Decide to generate the structure automatically.
Prompt
Using this dataset, create a 6-month driver-based revenue forecast with scenario modeling. Use the last available month as the starting point and project future values for customers and revenue. Model customer growth using new customers and churn, and calculate ending customers for each month. Forecast revenue using average revenue per customer, expansion revenue, contraction revenue, and one-time fees. Create three scenarios: Base Case, Best Case, and Worst Case by adjusting growth rate, churn rate, and revenue drivers. Generate a table showing projected revenue for each month under each scenario, and create a chart comparing the scenarios over time.
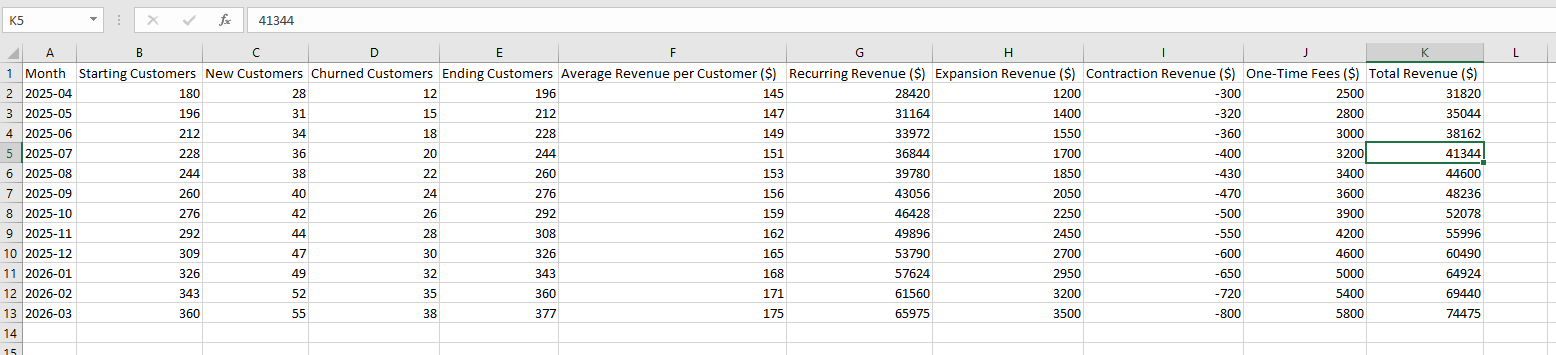
Source dataset
The starting sheet contains the operating drivers Decide needs: customers, churn, ARPC, expansion, contraction, and one-time fees.
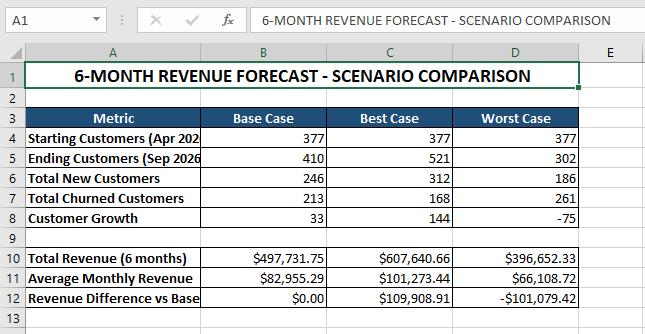
Scenario outputs
Decide turns the raw sheet into a structured revenue-planning model with side-by-side scenarios and chart outputs.
What Decide builds
After running the prompt, Decide can produce:
- a 6-month revenue forecast from the last observed month
- a driver-based customer model using acquisition and churn
- scenario assumptions for Base Case, Best Case, and Worst Case
- a monthly revenue table by scenario
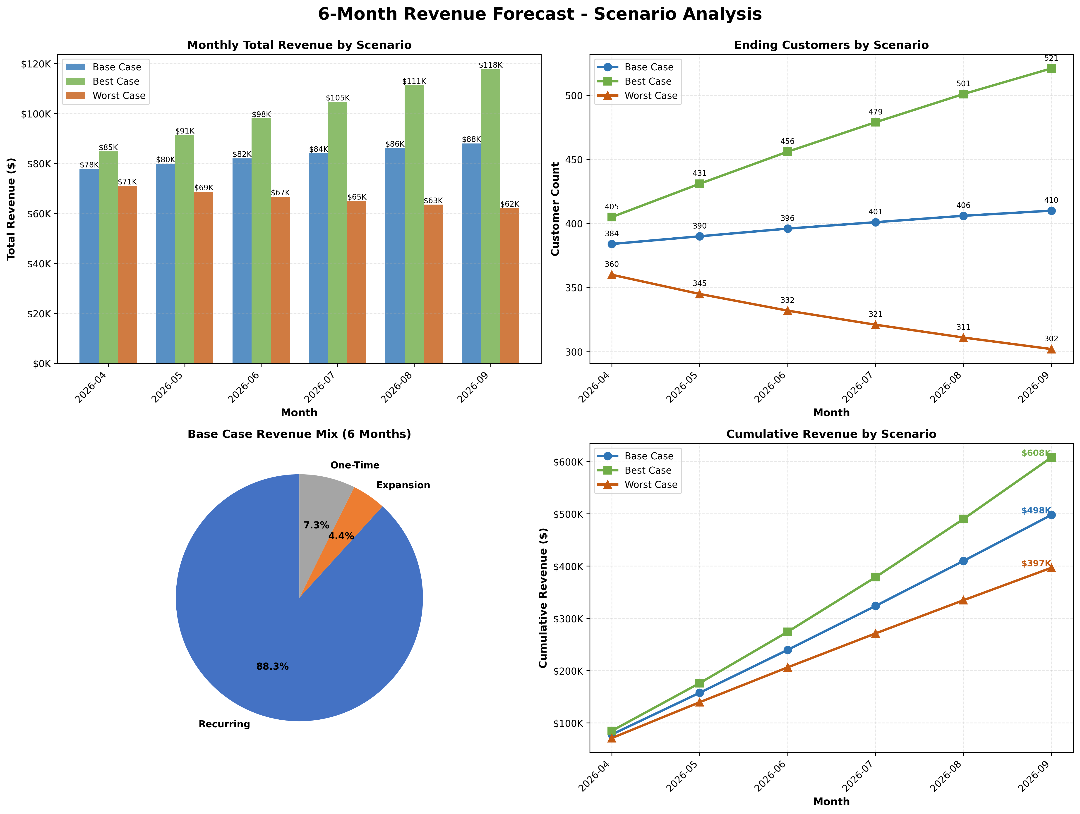
- a chart that compares how the three scenarios diverge over time
Review
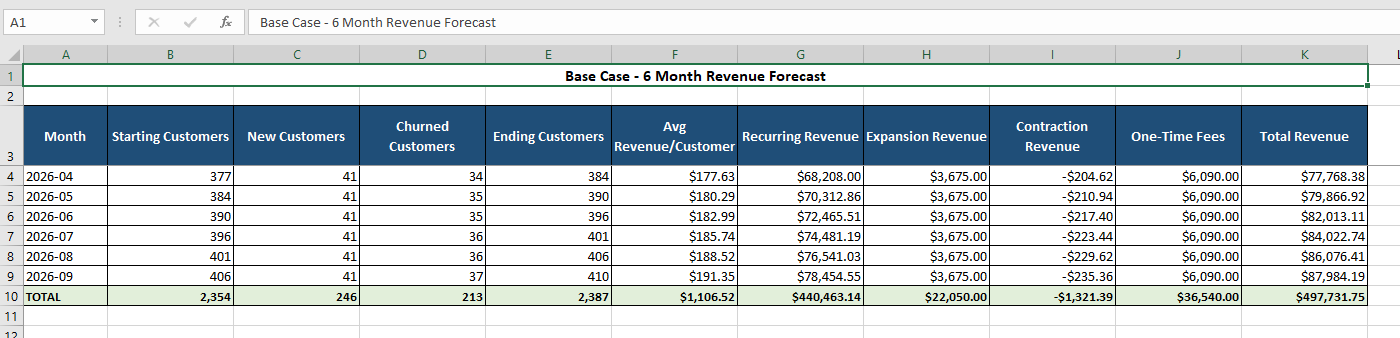
1. Driver-based forecast model
Instead of projecting one top-line revenue number blindly, Decide builds the forecast from business mechanics:
- customer growth
- churn
- pricing
- expansion revenue
- contraction revenue
- one-time fees
That creates a forecast that is more realistic and easier to audit.
2. Scenario modeling
Decide generates three versions of the forecast automatically:
- Base Case: steady performance based on recent history
- Best Case: stronger acquisition, lower churn, stronger expansion
- Worst Case: weaker growth, more churn, softer revenue drivers
This makes the model useful for planning rather than just reporting.
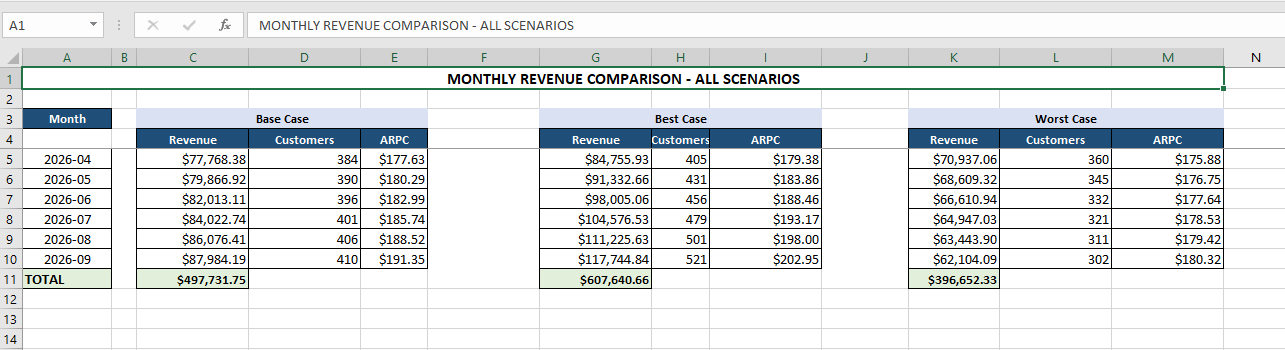
3. Forecast output table
The output table should clearly show:
- projected customers by month
- projected revenue by month
- comparison across all scenarios
That side-by-side view helps leadership understand both expected performance and risk.
4. Visualization
The scenario chart should make it easy to:
- see divergence over time
- compare downside and upside cases quickly
- explain the planning range to leadership or finance
Decision-making value
With this model, the startup can:
- understand how customer growth and churn drive revenue
- test how sensitive revenue is to core assumptions
- plan hiring, marketing, and spending against different outcomes
- prepare for downside risk while still targeting upside opportunities
For example:
- if churn rises slightly, the revenue impact becomes visible immediately
- if acquisition improves, leadership can justify scaling operations faster
Closing
This is the difference between a static spreadsheet and a planning model. Instead of manually wiring assumptions, formulas, and scenario tables together, you can ask Decide once and get a structured forecasting model that supports better business decisions.
Get started today with Decide
Related guides
Valuation
DCF Valuation in Excel Using AI
Turn revenue projections into a full DCF model with assumptions, discounted cash flows, terminal value, and enterprise value.
Pricing
How to Create a Profit Margin and Pricing Model in Excel with AI
Create a pricing model with profit, margin, break-even analysis, and scenario testing without building the formulas manually.
Forecasting
Trend and Time Series Analysis in Excel Using AI
Analyze trends, detect seasonality, and forecast demand from Excel data without pivot tables or formulas.